Power BI services that turn your Data into Business clarity

See what your numbers are really saying. With SkyBridge’s Microsoft Power BI Services, we help your teams uncover insights, track patterns, and make faster decisions – all from one dashboard. Whether you’re starting fresh or fine-tuning your existing setup, our Power BI experts work alongside you to turn complex information into clear, usable intelligence.

Let’s build a Power BI environment that makes data truly work for you.

Why Power BI Matters

Data is everywhere. The challenge is making sense of it. Microsoft Power BI brings everything together – numbers, reports, visuals – into one interactive workspace. Most businesses already collect data but rarely see its real value. That happens when systems don’t connect well or insights stay buried behind static reports.

Power BI changes that. It connects smoothly with Excel, SQL, cloud apps, CRMs, and more. Once integrated, it maps your business patterns in real time. You begin to see what’s working, what’s slowing down, and where future opportunities lie.

It’s flexible for any organization. Small teams get quick clarity. Enterprises get deep analytics and reporting that leaders trust.

Our Power BI Services

We help businesses build strong, practical, and insightful data analytics ecosystems with our specialized Power BI services.

Power BI Consulting

Our Power BI Consulting services help you move from questions to clarity. We start by understanding how data is currently used across your business, which tools are in place, and where reporting breaks down. This includes reviewing data sources, reporting workflows, and decision points across teams. We define KPIs, align metrics between departments, and design governance models that prevent confusion later. With that foundation, leadership teams work with the same numbers and act faster, without second-guessing reports.

Power BI Integration Services

Integration is often the most fragile part of any BI setup. Data lives across CRMs, ERPs, legacy systems, and internal databases that were never designed to talk to each other. Our Power BI Integration Services bring these sources together using secure connectors and custom integration layers. Data is cleaned, structured, and validated before it reaches Power BI, reducing errors and improving long-term stability.

Power BI Development Services

Once the data layer is solid, development begins. Our Power BI Development Services focus on building dashboards that are fast, reliable, and easy to use on a daily basis. This includes data modeling, DAX calculations, performance tuning, and report design. Dashboards are built for real usage, not demos, covering operational metrics, performance tracking, and trend analysis users can depend on.

Power BI Implementation Services

Power BI implementation involves more than publishing reports. It requires the right environment setup, security structure, and deployment process. Our Power BI Implementation Services cover the full rollout, including workspace configuration, data migration, deployment testing, and user onboarding. The result is a reporting environment that is ready for adoption, not one that needs fixing after launch.

Power BI Managed Services

Once Power BI is live, reporting needs ongoing care. Datasets grow, refresh schedules change, and new users come in with new questions. Our Power BI Managed Services handle continuous optimization, refresh monitoring, governance updates, and incremental enhancements. This keeps dashboards accurate and usable over time without adding pressure on internal teams.

Power BI Customization

No two businesses view data the same way. SkyBridge delivers Power BI Customization services that reflect how each organization operates and reports. Customization can include department-specific dashboards, tailored visual themes, embedded analytics, and advanced DAX logic. Role-based access ensures users see only what they need, while complexity stays behind the scenes.

Power BI Products We Specialize In

Our work spans the core Power BI products that teams rely on for building, sharing, scaling, and embedding analytics. These are not isolated tools for us. They usually show up together inside the same reporting environment.

Power BI Desktop

Most of the real work starts here. Data models, measures, and report logic are built and tested in Power BI Desktop before anything is shared. We spend time getting the model right early, because that decision affects every report that comes later. When Desktop work is rushed, problems surface only after users start complaining.

Power BI Pro

Power BI Pro is commonly used for sharing reports and collaborating across teams. It supports everyday reporting needs without the overhead of larger capacity setups. We usually see issues here when access and workspace structure are not thought through. Fixing that early avoids confusion around versions and ownership.

Power BI Premium

Premium is chosen when scale becomes a concern. Larger datasets, more users, or stricter performance expectations tend to push teams in this direction. Capacity planning matters more than visuals at this stage. Poor design choices can quietly drive up costs without improving reporting quality.

Power BI Mobile

Mobile access is often requested by leadership or field teams. Usage patterns are different here, and not every desktop report belongs on a phone. We simplify aggressively for mobile views. Fewer visuals, clearer priorities, and faster load times usually work better.

Power BI Report Server

Some organizations still need reporting to stay on-premise or within controlled environments. Power BI Report Server supports that requirement. These setups demand more discipline around deployment and versioning. Small misalignments tend to create support issues later.

Power BI Embedded

Embedded analytics are used when reports need to live inside applications rather than Power BI itself. This is common in customer-facing or internal platforms. The reporting experience has to match the product flow. When it feels bolted on, users notice immediately.

The platform Behind your Power BI

Power BI handles the reporting. Microsoft Fabric handles everything underneath it — data storage, pipelines, transformation, and governance, all in one place. When the two work together, dashboards are faster, data is more reliable, and your team spends less time managing infrastructure.

Talk to us about Microsoft Fabric

What Microsoft Fabric covers

Storage

OneLake

One unified storage layer for your entire organization. No silos, no copying data between systems before it can be used.

Pipelines

Data Factory

Build and manage data pipelines without needing separate tooling outside the Microsoft stack.

Engineering

Synapse Data Engineering

Prepare and transform data at scale using notebooks and Spark, inside the same environment.

Warehousing

Synapse Data Warehouse

Enterprise-grade SQL querying on structured data, ready to feed directly into Power BI reports.

Streaming

Real-Time Analytics

Stream and act on live event data as it arrives — not hours later after a scheduled refresh.

Reporting

Power BI

The reporting layer your teams already use, now running natively inside Fabric — not alongside it.

POWER BI + MICROSOFT FABRIC

Faster reports. No refresh delays. One source of truth

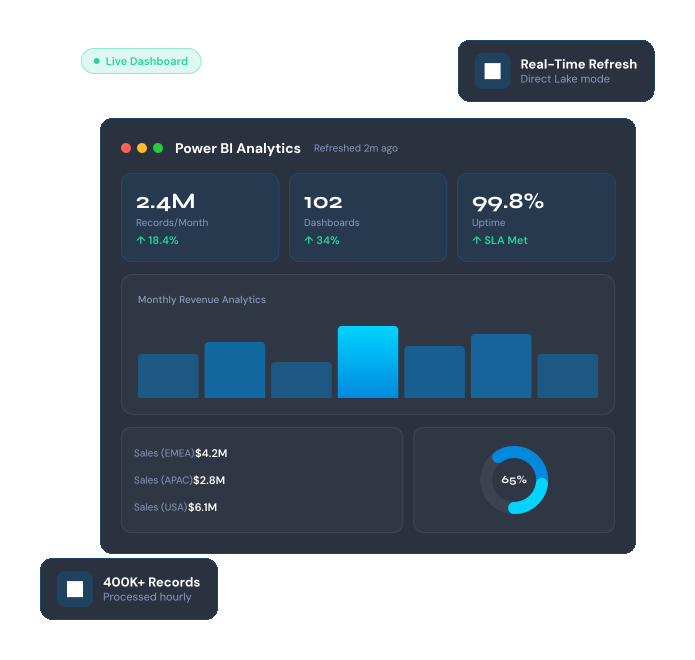
When Power BI runs on Fabric, reports connect to data through Direct Lake — near-real-time query performance without importing data or waiting on scheduled refreshes. Your dashboards stay current, your data stays in one place, and your team stops debugging stale reports.

Where Power BI Fits Into Your Business Operations

Centralize Data Across Teams

Power BI brings data from different systems into one reporting layer, so teams stop working in isolation. Sales, finance, and operations see the same numbers instead of maintaining their own versions. This reduces back-and-forth and avoids confusion over which report is correct.

Create One Source of Truth

With Power BI, metrics are defined once and reused across reports. This keeps KPIs consistent even when dashboards are built for different audiences. Over time, this builds trust in the data instead of constant questioning.

Track Business KPIs Clearly

Power BI dashboards make it easier to monitor key metrics without digging through spreadsheets. KPIs stay visible and updated based on live or scheduled data refreshes. This helps teams notice changes early rather than after problems escalate.

Improve Reporting Speed

Manual reporting takes time and usually breaks when data grows. Power BI automates refreshes and calculations so reports are ready when needed. Teams spend less time preparing data and more time reviewing outcomes.

Support Better Day-to-Day Decisions

When data is accessible and easy to read, decisions become less reactive. Power BI allows users to explore trends, compare periods, and drill into details without technical help. This supports quicker, more informed choices across roles.

Scale Analytics as You Grow

As data volume and users increase, Power BI can scale without rebuilding everything from scratch. Models and dashboards are extended rather than replaced. This keeps analytics aligned with business growth instead of becoming a bottleneck.

Success Stories That Speak Through Outcomes

$1B Automotive Manufacturer

Turning Sales Data into Targeted Revenue Growth

Client: Extended Warranty Sales Analytics Initiative

We built a centralized Power BI analytics layer integrating data from SAP, Microsoft Dynamics, SharePoint, and Oracle to process 400,000+ records every month. Role-based dashboards with hourly refresh gave CXOs, Sales Managers, and Dealers the right level of insight at every tier. Sales teams shifted from broad campaigns to high-conversion targeting using real-time customer and claims data.

400K+

Records/Month

6

Sources Integrated

360°

Sales Visibility

Swedish Battery Manufacturer

Migrating and Simplifying Enterprise BI at Sca

Client: Tableau to Power BI Migration

We led a full-scale migration from Tableau to Power BI, consolidating 300+ legacy reports into 102 optimized dashboards powered by 52 curated datasets. Complex Tableau expressions were rebuilt into modular DAX formulas, handling 2 million records per month without performance trade-offs. The unified Microsoft analytics platform now covers EMEA-wide reporting across Sales, Finance, HR, Production, and more.

300+

Reports Consolidated

2M

Records/Month

102

Optimized Dashboards

$1B Automotive Manufacturer

Making Warranty and Quality Analytics Actionable

Client: Failure Frequency & Warranty Claims Reporting

We designed Power BI reports to analyze 900,000+ warranty and claims records per month, with granular drill-downs from country level down to region, state, dealer, vehicle, part, and failure reason. Quality and service teams gained early signals to act before issues escalated into costly claims. Decision-makers achieved complete visibility into failure trends and brand risk, all in a single platform.

900K+

Records/Month

6

Level Drill-Down

360°

Comprehensive Reports Built

Real Numbers from Our Power BI Work

These numbers reflect what our Power BI services typically handle in real environments.

400,000+ lakh records processed every month for sales and customer analytics

900,00+ warranty and claims records analyzed monthly

100+ Power BI dashboards delivered across business and operations teams

300+ legacy reports consolidated into scalable Power BI models

2 Million+ records handled per month in enterprise BI setups

50+ complex parameters per record modelled without performance loss

Hourly real-time refresh for business-critical reporting

CXO-to-operational visibility enabled through role-based access

Get Started with Power BI Services

Your data already holds the answers. You just need the right way to see them. SkyBridge turns existing data into clear, interactive views using Microsoft Power BI. We’ll help organize your numbers into dashboards that guide everyday business choices and give leadership real visibility.

Let’s talk about what Power BI could do for you.

Schedule a Consultation

FAQ's

Some questions
you may have

If you have any doubts or questions, please refer to the FAQ section. We have explained the basic FAQs along with their answers, which will help provide clarity.

1. What do Power BI services typically include?

Power BI services usually cover consulting, integration, development, implementation, customization, and ongoing managed support. The scope depends on your data complexity, reporting needs, and user scale.

Power BI consulting services help define KPIs, review data sources, and design a reporting strategy that aligns with business goals. This ensures dashboards support real decisions, not just visual reporting.

Yes. Power BI integration services support data from CRMs, ERPs, databases, cloud platforms, and legacy systems. Secure connectors and custom integration layers are used where standard connections fall short.

Power BI development services include data modeling, DAX calculations, dashboard design, performance optimization, and report deployment. Dashboards are built for daily business use, not demos.

Yes. Power BI implementation services cover environment setup, data migration, workspace configuration, testing, and user onboarding. This helps teams adopt Power BI without internal disruption.

Power BI managed services handle ongoing maintenance, refresh monitoring, performance tuning, and enhancements. This keeps dashboards accurate as data volumes and users grow.

Yes. Power BI customization services allow role-based dashboards, custom visuals, branded layouts, and advanced DAX logic. Each team sees data relevant to their role, with secure access controls.

Chat With Us

We typically reply in few minutes.