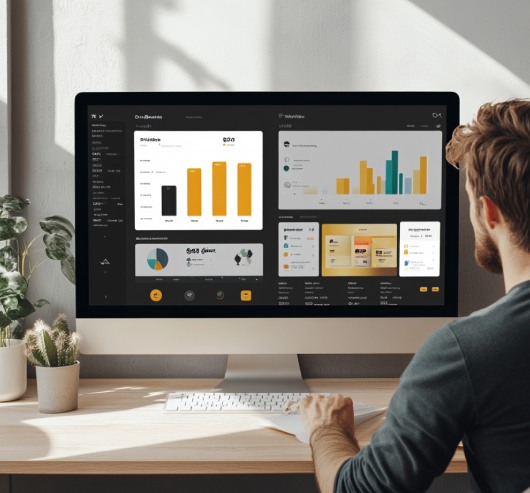
Tableau is known for strong, flexible data visualisation. It turns complex data into clear visuals that are easy to read and easy to question. Analysts can spot patterns, trends, and gaps quickly without digging through layers of reports.
Tableau connects smoothly with modern data platforms like Google BigQuery and other Big Data systems, including Hadoop-based environments. Its wide range of native connectors makes it easier to pull data from multiple sources without heavy custom work.
Tableau lowers the barrier to data analysis. Its user interface is built around exploration, not configuration. With drag-and-drop interactions, even non-technical users can analyse data and answer questions without relying on complex queries.
Tableau is built to work with large and complex datasets. It processes high data volumes efficiently and allows users to analyse and visualise big data without performance becoming an immediate limitation.
Tableau makes reports accessible across desktops, tablets, and mobile devices. Dashboards automatically adapt to different screen sizes, allowing teams to review insights from anywhere without losing clarity or usability.
We have good exposure in Tableau Desktop. With this we create reports, dashboards and narrative boards as well as for connecting to and exploring data. Our Tableau dashboard development work supports broader Tableau BI services, covering everything from basic data connections to advanced calculated fields. The reports we build help teams spot patterns they would miss otherwise.
We use Tableau Server for intra-organizational sharing of reports, dashboards, and data resources. Either on-site hosting or Amazon Web Services (AWS) is used for hosting. Security matters when you're dealing with company data, so we set up permissions and access controls that make sense for your team structure.
It is a software as a service (SaaS) that is hosted on Tableau's servers and provides businesses with the same capabilities as the on-premises version. No infrastructure to manage on your end. We handle the setup and configuration so your team can start using it without the usual technical headaches while adopting Tableau BI services.
It is an open source platform that is frequently used by bloggers, journalists and data aficionados to examine both public and private data. We help organizations use it for public-facing data stories and interactive visualizations that engage audiences outside your company walls.
Many Tableau dashboards look fine and then stop getting used. Ours are built around how teams actually work, what they check during reviews, and what decisions depend on the data. That's why these dashboards stay relevant and don't fade out after the first few weeks, especially when guided by structured Tableau consulting services.
We work across Tableau Desktop, Server, Online, and Public. This gives teams flexibility in how data is built, shared, and presented. Nothing is forced into a setup that doesn’t fit. The platform is used the way it’s meant to be used.
We focus on clear data connections and consistent calculations so numbers don’t change unexpectedly. When logic is clean, trust builds naturally. Teams spend less time questioning reports and more time using them to move work forward.
As data volumes grow and more users come in, dashboards often slow down or break. We design Tableau BI reports to handle growth without constant fixes. This keeps reporting stable and usable over time.
Tableau needs structure, but not bureaucracy. We help organize reports, manage access, and reduce duplication while keeping things practical. Teams stay in control without feeling blocked by heavy processes.
Clients value clear communication and a straightforward approach. We work closely with internal teams, respect existing systems, and avoid unnecessary complexity. That makes Tableau projects smoother and easier to maintain.
If your Tableau environment isn’t giving you clear, dependable reporting, it’s time to address it. SkyBridge works with teams through Tableau consulting services to stabilise existing dashboards, improve performance, and bring structure to Tableau without disruption.
Start with a conversation. We’ll look at what’s working, what isn’t, and what needs to change to make Tableau useful again.
Tableau consulting services help businesses design reliable dashboards, improve data structure, and fix performance or usability issues. The goal is to make Tableau reporting consistent, scalable, and usable for daily decision-making.
Tableau dashboard development includes connecting data sources, building calculations, designing visual layouts, and configuring filters and parameters. Dashboards are created to support specific business questions rather than generic reporting views.
Yes. SkyBridge provides Tableau Server services and Tableau Online services, including setup, configuration, publishing dashboards, managing access, and supporting environments hosted on-premises or on AWS.
Yes. Tableau is widely used for big data analysis and can work with large, complex datasets from platforms like Google BigQuery and Hadoop-based systems. Performance depends on proper data modelling and implementation.
Tableau is designed to be easy to use for non-technical users. Its drag-and-drop interface allows business users and executives to explore data and interact with dashboards without writing code or complex queries.
Chat With Us
We typically reply in few minutes.